How to profit from the gap between two assets without predicting direction
Most traders spend their careers trying to answer one question: is this asset going up or down? Institutional traders ask a different question: is this asset going up more than that one, or down less? That question is easier to answer, more consistent to profit from, and works in bull markets, bear markets, and flat markets alike. This lesson teaches you how to construct, monitor, and manage a spread trade on perpetual contracts using two charts, a simple calculation, and a clear understanding of the carry running on each leg.
Why professional traders bet on relationships instead of direction.
An outright trader has to answer the hardest question in markets: where is this price going? Everything that moves an asset has to be forecast correctly. Macro, positioning, flows, sentiment, and whatever headline lands tomorrow morning. Get the direction wrong and it does not matter how good the rest of the analysis was.
A spread trader replaces that question with a narrower one. Buy one instrument, sell another, and you no longer need to know where either price is going. You need to know which of the two performs better. That is a different question, and for most traders it is a more answerable one.
Must forecast every factor that moves the price, including the ones nobody can see coming. One wrong call on direction erases the rest of the work.
Only needs to know which of two instruments performs better. Direction can go either way and the position still works if the relationship moves as expected.
The reason the relationship question is easier is that the two legs share most of their drivers. When you are long one instrument and short another, whatever moves both of them at once largely cancels out. A rate decision, a risk-off session, a macro headline that hits everything, those affect both legs and net out of the position. What remains is the specific difference between the two instruments, which is a much smaller thing to have a view on. Instead of forecasting the whole market you are forecasting one relationship inside it.
That is why spread strategies are a primary tool on professional desks rather than a niche one. Cancelling out the shared drivers means lower volatility per position and lower margin requirements, and it puts the trader’s capital behind the one thing they actually researched rather than the market’s general direction. The edge does not come from being right about where prices go. It comes from understanding how two instruments move relative to each other.
What you give up is simplicity. Two legs means two sets of fees, funding running on both sides, and a relationship you need to keep an eye on. None of that is difficult once you know what to look at, and the rest of this lesson walks through each piece.
Three types of spreads. Different risks. Different approaches.
Not all spreads behave the same way. The relationship between the two legs determines how the spread moves, how quickly it can reverse against you, and how you should size it. There are three types worth knowing.
Long the perpetual contract, short the fixed-date futures contract on the same underlying. The spread earns or pays the difference between the funding rate and the basis depending on which is higher. Direction is largely hedged out because both legs move with the same underlying price.
Long one instrument, short another in the same sector or industry. The shared environment cancels broad market moves. The spread captures a specific divergence between the two names. Moves can be fast and large.
Long one asset class, short another, connected by a macro thesis rather than direct correlation. Requires a directional view. Trends for weeks or months. Exit when the macro thesis changes or your dollar stop is hit, whichever comes first.
The signal chart: how to read the historical relationship before you enter.
Before entering any spread you need to see the historical relationship between the two instruments. The signal chart does this by dividing the price of the long leg by the price of the short leg. When the resulting ratio is rising, the long leg is gaining ground against the short leg. When it is falling, the short leg is gaining. This is your primary tool for identifying when a spread thesis is playing out and when to enter.
In TradingView the symbol search bar is the field at the top left of the chart screen where you normally type an instrument name like BTC or SPY. It accepts mathematical expressions too. Type the following directly into it:
The signal chart is used for two things only. Identifying the trend direction to decide whether your macro thesis is playing out. And identifying historical entry and exit levels. It does not show your dollar profit or loss. That requires the P&L chart covered in the next section.
How to construct the position: equal notional, unit sizes, and the P&L formula.
Once the signal chart confirms your thesis is playing out, you execute both legs on OKX at equal notional value. Equal notional means you put the same dollar amount on each side. If you put $5,000 long on BTC you put $5,000 short on QQQ. This keeps both legs balanced so neither one dominates the spread.
After executing, you need two numbers: the number of BTC units you hold and the number of QQQ units you shorted. These are fixed for the life of the trade. You calculate them from your actual fill prices.
Those unit numbers never change, even if BTC or QQQ prices move significantly after entry. They are fixed from the moment you enter until the moment you exit. Do not rebalance the legs as prices move. Rebalancing changes your entered price and makes the P&L chart meaningless as a benchmark. Enter with fixed units. Exit with the same fixed units.
Some traders adjust leg sizes by each asset’s volatility rather than equal notional. That approach can neutralize dollar risk per percentage move more precisely. But it creates a different ratio than the price chart you are watching, which makes the chart harder to use as your primary monitoring tool. This lesson uses equal notional because the chart and the position stay consistent. Both approaches are valid. Equal notional is simpler and more transparent for most retail traders.
Execute both legs as close to simultaneously as possible. If you enter one leg and wait to enter the other, you are carrying a naked directional position until the second leg fills. On liquid perpetual markets where both BTC and QQQ are highly liquid, a few seconds of legging risk on a macro-driven multi-week trade is manageable. But entering one leg and leaving the other for hours or days is not a spread. It is a directional bet with a plan to hedge later.
The P&L chart: how to monitor your exact USDT profit or loss in real time.
The signal chart tells you whether your thesis is playing out. The P&L chart tells you how much money you are making or losing. They are two different tools serving two different purposes. Do not use the signal chart for P&L. The ratio in the signal chart is a price relationship number, not a dollar amount. A move from 87 to 95 in the ratio looks like an 8-point gain but the dollar value of that move depends entirely on your position size and current prices.
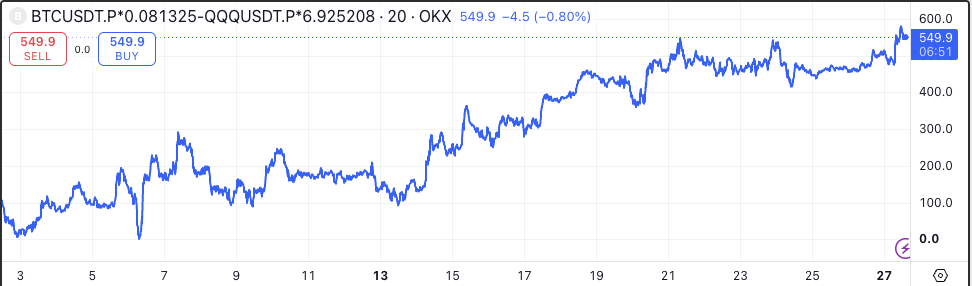
The P&L chart uses a subtraction, not a division. It calculates the USDT value of your long leg minus the USDT value of your short leg. Both legs are USDT-denominated perpetual contracts so the subtraction gives you an exact dollar figure. At entry the two legs are equal in dollar terms so the chart starts at zero. Every point above zero is profit in USDT. Every point below zero is a loss in USDT.
Type this formula into TradingView using your actual unit sizes from the construction step:
Draw a horizontal line at the chart value when you entered. Set a second line at your target and a third at your stop. The chart does the rest. Check it once a day. The number on the Y-axis at any moment is your exact dollar P&L on the spread.
Use the signal chart (divisor) before entry to read the historical relationship, identify the trend, and time your entry. Use the P&L chart (subtraction) after entry to monitor your exact dollar position. The signal chart tells you if you are in the right trade. The P&L chart tells you how much that trade is worth right now.
Carry on perpetual spreads: the hidden component the price chart does not show.
Every perpetual spread has two P&L components. The price component, which the P&L chart shows you. And the carry component, which runs silently in the background typically every eight hours when perpetual funding settles. You can see the current funding rate and next settlement time for any perpetual contract on your exchange by opening the contract and looking at the funding rate display near the top of the screen. The P&L chart captures only price. It does not capture what the funding rates on each leg are earning or costing you while you hold the position.
Each leg of a perpetual spread has its own funding rate. The long leg pays or earns funding depending on whether the perpetual market is net long or net short. The short leg earns or pays the opposite. The net carry on your spread is the difference between the two.
Net daily carry equals the long leg notional multiplied by the long leg funding rate divided by 365, minus the short leg notional multiplied by the short leg funding rate divided by 365.
Carry matters differently across the three spread types. For calendar spreads, carry is the entire trade. Long the perpetual collects funding. Short the fixed-date futures pays basis. The spread earns the difference. Price direction is hedged. For pairs trades, carry is meaningful but secondary to the price thesis. Check both legs before entry. For cross-asset spreads, carry is a fair value input. It adjusts how far the price ratio needs to move for the trade to be worth holding. A spread where both the price and the carry are working in your favor is the strongest setup this lesson can produce. Module 5 of the core curriculum covers the full zero delta framework including the basis net of carry formula and worked examples at depth.
The seven-step spread trade checklist.
Look up the perpetual funding rates on both legs on OKX. Calculate the net daily carry using the formula above. If carry is strongly against you, the spread needs to move further in your direction to be worth holding. Adjust your target or pass on the trade until conditions improve.
Calendar, pairs, or cross-asset. This determines your sizing, your exit approach, and how much room to give the spread before stopping out. Calendar and pairs can be larger. Cross-asset should be smaller. Use the sizing framework from Lesson 6.
Type the divisor formula into the TradingView symbol search. BTCUSDT.P/QQQUSDT.P for the BTC/QQQ spread. Confirm the ratio is trending in the direction your thesis predicts. Do not enter a spread without first looking at the signal chart.
For calendar spreads: carry differential between the perpetual and the futures basis. For pairs trades: a specific divergence in business model, earnings quality, or sector positioning between two correlated names. For cross-asset spreads: a macro thesis from the Lesson 4 framework identifying which way the relationship should move.
Equal notional on both sides. Note your exact fill prices on both legs. Execute as close to simultaneously as possible to avoid legging risk. One leg without the other is a naked directional position, not a spread.
BTC units equals leg size divided by BTC fill price. QQQ units equals leg size divided by QQQ fill price. Enter the subtraction formula in TradingView. Draw a horizontal line at zero. Set your target line above and your stop line below. The Y-axis is now your exact USDT P&L in real time.
Set two exit conditions before every trade. First, a thesis-based exit: for calendar and pairs spreads this is when the specific divergence resolves or the ratio returns to its historical mean. For cross-asset spreads this is when the macro conditions that drove the entry change. Second, a dollar-based stop: your maximum pain level if the thesis takes longer than expected or you misread the conditions. The stop on a spread should be wider than on a directional trade since the spread has lower volatility by design. Use the signal chart historical range to calibrate a level that reflects genuine relationship breakdown, not normal noise. Write both down before you enter.
The BTC/QQQ cross-asset spread: July 3 to July 27, 2026.
The BNOC trade from Lesson 3 is the series example of a calendar spread, and the one where carry is the primary P&L driver rather than the adjustment layer. Long the BTC perpetual, short the fixed-date BTC futures. The spread earns or pays the difference between perpetual funding and the futures basis. Unlike the cross-asset and pairs spreads above, the calendar spread has no directional price thesis. The edge comes entirely from carry. When funding is above basis you earn the difference. When they converge the spread compresses and the trade is less attractive.
Read Lesson 3: Basis Net of Carry →The edge in spread trading is not in knowing where assets go. It is in knowing how they move relative to each other. Before you enter any spread: check the carry on both legs, identify your spread type, confirm the signal chart is trending in your direction, and define your exit conditions. After you enter: use the subtraction formula in TradingView to monitor your exact USDT P&L. Do not rebalance. Do not use the signal chart for P&L. Set two exit conditions before every trade. A thesis-based exit for when the macro or fundamental reason for the spread reverses. And a dollar-based stop as your maximum pain level for when the thesis takes longer than expected or you read the conditions wrong. The thesis tells you when the trade is wrong. The stop protects you while you find out.
Lesson 6 covers the sizing framework this lesson references for calibrating spread size by type. Module 5 of the core curriculum covers zero delta strategies, the family all three spread types in this lesson belong to.
Read Lesson 6: Risk Management →This content is produced by Harmonic for educational purposes. It is strategy education, not investment advice.
Both issues, every week, delivered as clean PDFs you can read anywhere: