Home / Learn / Trading Strategies
What Strategies Should I Use in Crypto? Match the Strategy to the Market
Education only. Not financial advice. Trading derivatives carries a high risk of loss.
Short answer
The right strategy depends on two things: what the market is doing and how much risk you can manage. Trending markets suit directional trades, sideways markets suit strategies that collect premium or fade extremes, and volatile markets suit strategies built around big moves. Identify the market condition first, then pick the strategy.
- Strategy by market condition
- Crypto futures vs spot trading
- Crypto futures vs options trading
- What is spread trading in crypto?
- Mean reversion and trend following
- How to pick a strategy you can manage
- FAQ
Strategy by market condition
If you are asking what strategies should I use in crypto, start with the market, not the strategy. Identify the condition first, then choose the tools that fit it. A mean reversion signal in a trending market leads straight to a loss, and a trend-following signal in a range-bound market leads to whipsaws. Matching the strategy to the condition is the first decision, and mismatching them is one of the most common sources of losses.
| Market condition | How to recognize it | Strategies that fit | Main risk |
|---|---|---|---|
| Trending up | Higher highs and higher lows. The 50 EMA is above the 200 EMA. A trend strength reading above 25 | Trend following, long futures, buying calls or a bull call spread to lower the cost | Entering late, or a crowded long with high funding |
| Trending down | Lower highs and lower lows. The 50 EMA is below the 200 EMA. Trend strength above 25 | Short futures, buying puts or a bear put spread | A sharp reversal against the short |
| Range-bound | Price moves between support and resistance. Trend strength below 20 | Mean reversion, covered calls, iron condors | A breakout through the range |
| High volatility | Large swings, or a known event ahead, such as a central bank decision | Long straddle or strangle if you expect a big move. A defined-risk short volatility trade, such as an iron condor, if you expect volatility to fade | Volatility collapsing after you buy options, or a large move through a short strike |
“Trend strength” here is the ADX indicator. Readings above 25 suggest a trend strong enough to follow, and readings below 20 suggest no trend. You do not need to memorize the indicators to use the idea. The point is to name the condition before you pick a trade.
Crypto futures vs spot trading
Most retail crypto users buy spot and hold. Derivatives change that, and Harmonic’s curriculum puts them at about 73% of crypto exchange trading volume in the first quarter of 2026, nearly 10 to 1 against spot. The two work differently.
| Spot | Futures (perpetuals) | |
|---|---|---|
| What you hold | The asset itself | A contract whose value is derived from the asset |
| Leverage | None. You pay the full price | Yes. You post a fraction as margin and control a larger position |
| Shorting | Requires borrowing the asset | Open a short with no borrowing |
| Funding | None | Perpetuals pay or charge funding every few hours |
| Liquidation | None | If margin falls to the maintenance level, the exchange closes the position |
| Ownership | You own the asset | You get the exposure the asset brings, but not the asset itself |
The extra tools in futures come with extra ways to lose. Learn how funding works in our guide to perpetual futures and funding rates, and how liquidation works in our guide to margin, liquidation and risk management.
Crypto futures vs options trading
Futures and options both let you express a view on price, but they behave differently. This table compares futures with a bought option.
| Futures | Options (bought) | |
|---|---|---|
| Payoff | Linear. You gain or lose roughly in line with the price | Non-linear. Loss is limited, and profit can be large if the move is big enough |
| Maximum loss | Your margin if isolated, and liquidation if the price moves far enough against you | The premium you paid. No liquidation and no margin call |
| Cost | Margin, plus funding on perpetuals | The premium, paid up front. Time decay works against the buyer |
| Complexity | Lower. Direction, leverage and funding | Higher. Strike, expiry, implied volatility and the Greeks |
Selling an option is a different position. It requires posting margin, and an uncovered short option can lose far more than the premium collected. Our guide to crypto options trading covers the main structures.
What is spread trading in crypto?
Spread trading means you profit from the gap between two assets without predicting direction. You buy one instrument and sell another. You no longer need to know where either price is going. You only need to know which of the two will perform better.
That question is often easier to answer, because the two legs share most of their drivers. A rate decision or a risk-off session hits both legs, so it largely cancels out of the position. What remains is the difference between the two instruments. The cost is that you have two legs, which means two sets of fees, funding running on both sides, and a relationship you have to monitor.
Three common types
- Calendar spread. Long the perpetual and short a dated future on the same asset. It earns or pays the difference between the funding rate and the basis. Direction is largely hedged out.
- Pairs trade. Long one instrument and short another in the same sector. The shared environment cancels broad market moves, but the spread can move fast.
- Cross-asset spread. Long one asset class and short another, connected by a macro view. It needs a directional view and can trend for weeks or months.
A spread trade example from Lesson 7
Example from Harmonic’s Lesson 7
The lesson’s worked example is a cross-asset spread on OKX. You go long Bitcoin and short the QQQ perpetual at equal notional, $5,000 on each side, entered on July 3, 2026. The thesis comes from the macro framework in Lesson 4.
| Long Bitcoin leg | Short QQQ leg | |
|---|---|---|
| Notional | $5,000 | $5,000 |
| Entry price on July 3 | $61,482 | $722 |
| Units, fixed from entry | 0.081325 BTC | 6.925208 QQQ |
The profit and loss is the dollar value of the long leg minus the dollar value of the short leg. At entry the two are equal, so the result starts at zero. Between July 3 and July 27, the ratio of Bitcoin’s price to QQQ’s price rose from 87.08 to 95.04, which means Bitcoin outperformed QQQ. On daily closes, the spread was up $432.95 by July 27. The lesson keeps the unit sizes fixed after entry and does not rebalance, so the profit and loss stays measurable.
A pairs trade works the same way inside one sector. In Lesson 7, the pairs example is short Tesla and long Intel, an AI spender versus an AI earner, and the ratio between them moved roughly 23% in two days.
Harmonic Academy has a live Lesson 7 dashboard for this. It tracks price, funding and correlation across 18 instruments on OKX and Hyperliquid, with a cross-exchange arbitrage monitor and a spread builder. The lessons, the live lesson tools and the core curriculum are part of Harmonic Academy, along with the weekly briefs.
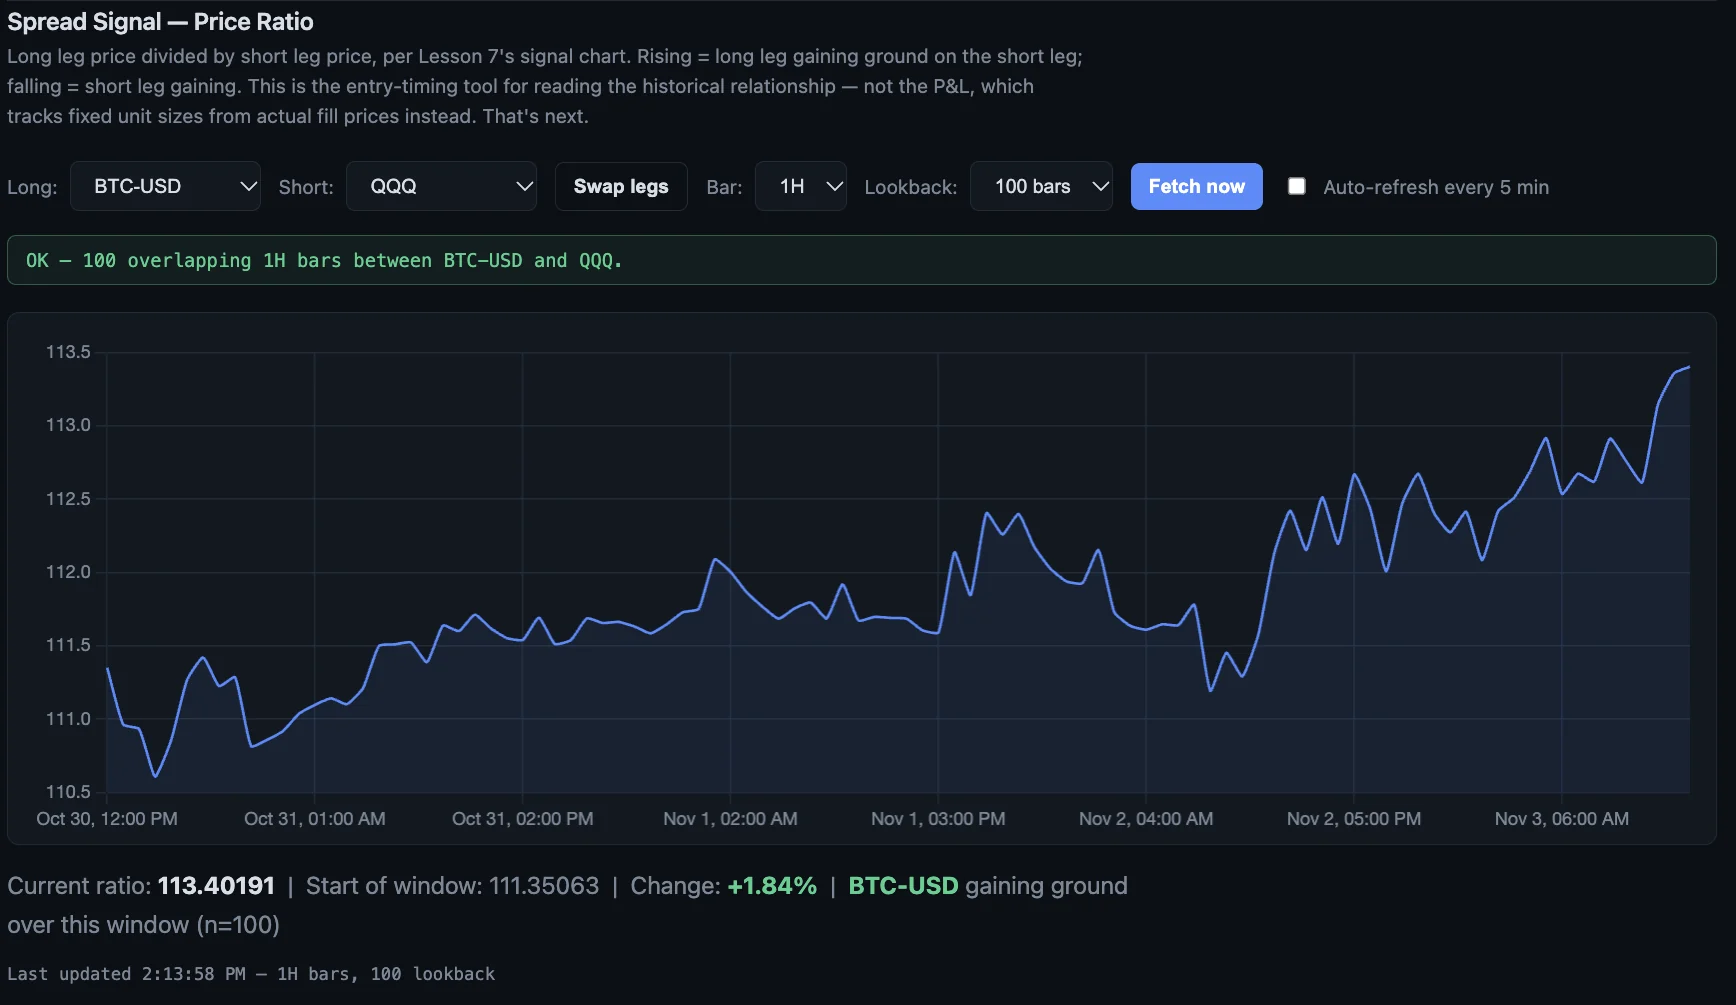
In this capture, the Bitcoin to QQQ ratio reads 113.40191, up 1.84% over the last 100 hours. A rising ratio means the long leg, Bitcoin, is gaining ground on the short leg, QQQ. For comparison, the ratio was 87.08 at Lesson 7’s July 3 entry.
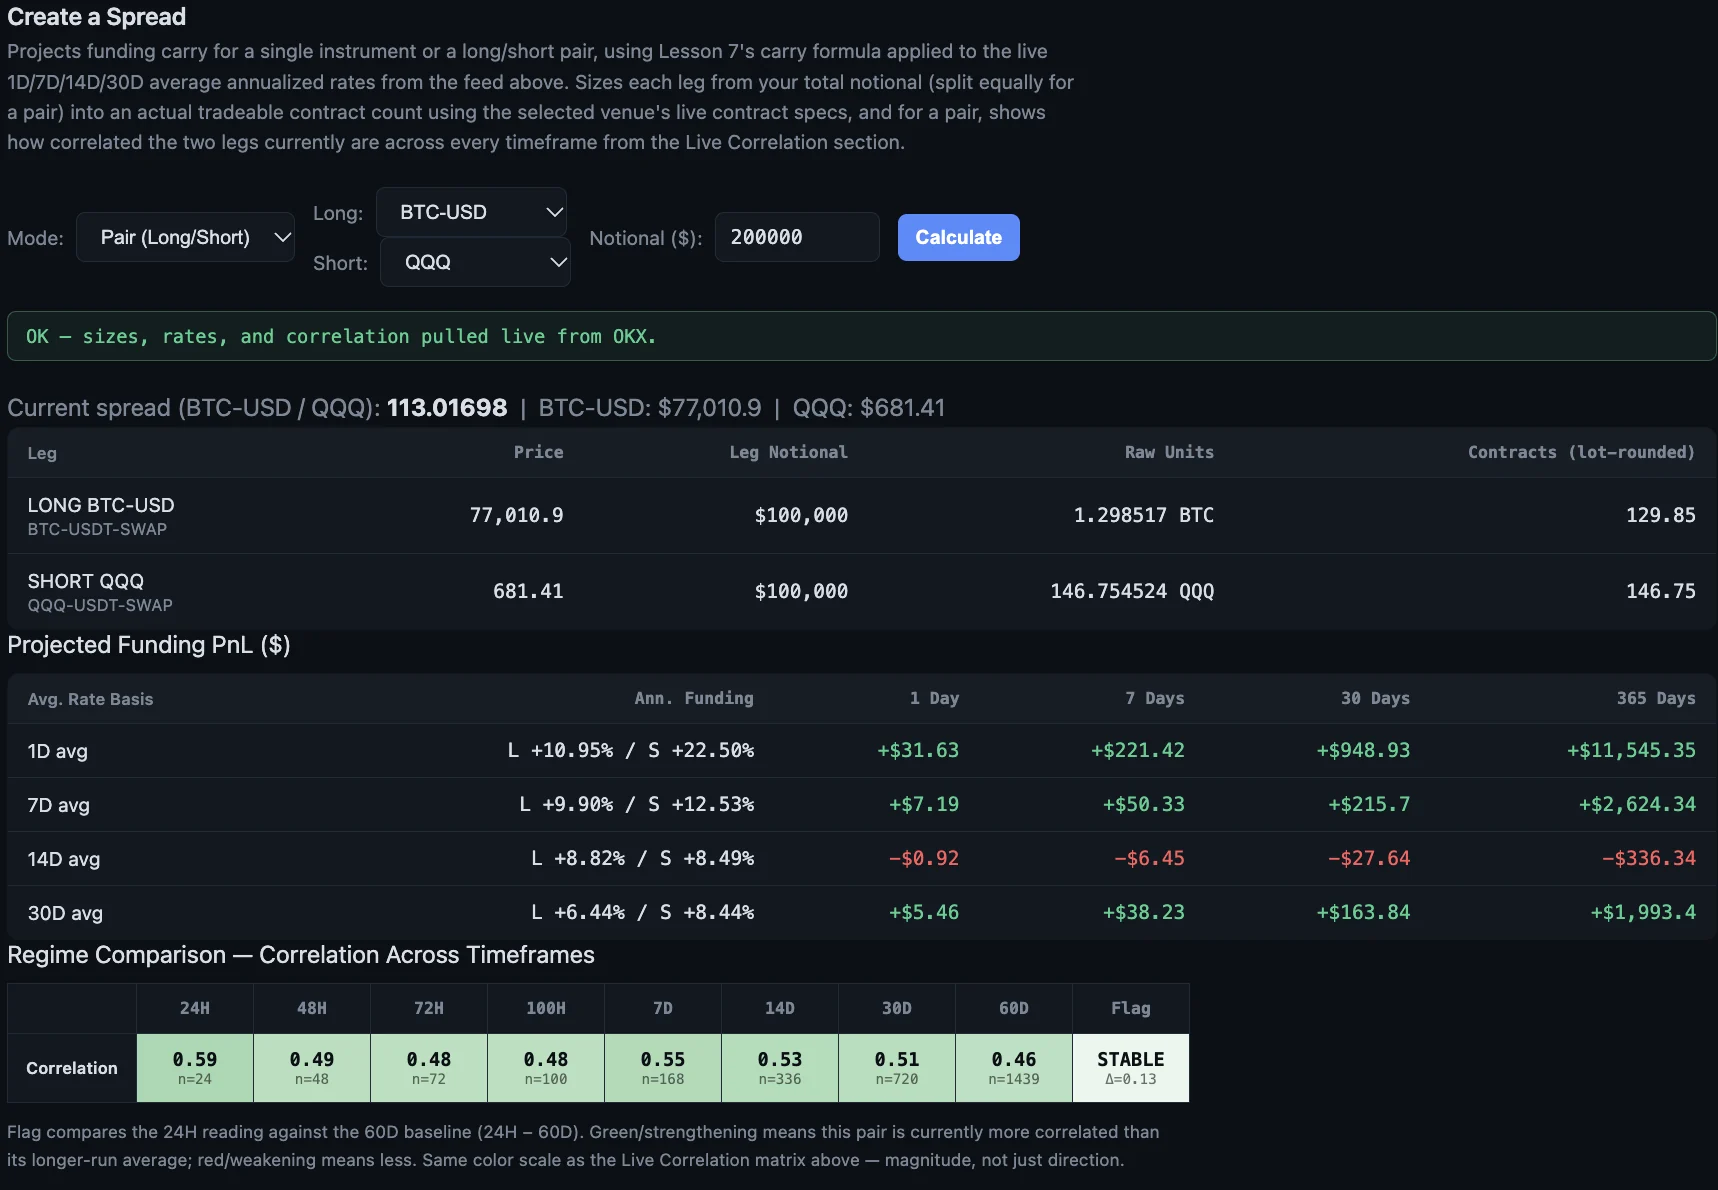
In this capture, a $200,000 pair puts $100,000 on each leg and sizes them at 1.298517 BTC and 146.754524 QQQ. It projects funding carry of between −$27.64 and +$948.93 over 30 days, depending on which averaging period it uses, and it shows the two legs’ correlation at between 0.46 and 0.59 across timeframes.
Mean reversion and trend following
Two frameworks cover a lot of ground, and they are opposites.
- Trend following. The assumption is that prices in motion tend to stay in motion. You identify an established trend and position in its direction until it shows signs of reversing. It works when there is a trend and produces whipsaws when there is not.
- Mean reversion. The assumption is that prices tend to return to an average after moving to extremes. It works best in range-bound markets and fails in trending markets, where price can stay extended far longer than expected.
The same indicator can give opposite signals in different frameworks. An RSI reading above 70 is a sell signal in mean reversion and a sign of strong momentum in a trend. That is why the framework comes before the indicator. Breakout and momentum strategies are two more frameworks, each suited to a different condition.
The full treatment, with the indicators for each framework, is in Module 7 of the core curriculum in Harmonic Academy. Our guides to options and perpetual futures cover the instruments these strategies use.
How to pick a strategy you can manage
The best strategy on paper is the wrong one if its risk is bigger than you can handle. Link your choice to your risk limits:
- Name the market condition. Trending, range-bound or volatile.
- Know the worst case before you enter. A bought option can lose its premium and no more. A leveraged futures position can be liquidated. A spread has two legs that can both move against you.
- Size the position from your stop. Risk a small, fixed share of your account on any one trade. Our risk management guide shows the formula.
- Count the ongoing costs. Funding on perpetuals, time decay on options, and fees on every leg.
- Write down your idea and your exit before you trade. If you cannot state what would prove you wrong, you are not ready to enter.
If you already hold spot, a common starting point in the curriculum is the covered call, because it is backed by the asset you own and carries no liquidation risk. That is an example of the education, not a recommendation.
Frequently asked questions
What strategies should I use in crypto?
It depends on the market condition and your risk limits, so identify the condition first. Trend following suits trending markets, mean reversion and premium-selling suit sideways markets, and long volatility strategies suit markets expecting large moves. Using the wrong strategy for the condition is a common source of losses.
What is spread trading in crypto?
A spread trade buys one instrument and sells another, so you profit from how the two perform relative to each other instead of from the direction of the market. Because the legs share most of their drivers, broad market moves largely cancel out. It uses two legs, so it also means two sets of fees and funding.
What is the difference between futures and spot trading?
Spot means you buy and hold the asset itself. Futures are contracts that let you use leverage and short without borrowing, but they add funding costs on perpetuals and the risk of liquidation. Spot has neither leverage nor liquidation.
Should I trade futures or options?
Neither is better in every case, because they suit different goals and risk tolerances. Futures have a straightforward payoff but carry liquidation risk, while a bought option has a maximum loss equal to its premium but loses value over time. Options are also more complex, with strikes, expiry dates and implied volatility to understand.
Which strategy works in a sideways market?
Mean reversion and premium-selling strategies are built for range-bound conditions. Examples include selling covered calls on spot you already hold and running iron condors, which profit if price stays between the short strikes. Both lose when price breaks out of the range, so define your risk before you enter.
Can I trade without predicting direction?
Yes, to a degree. A spread trade removes the need to forecast where the market is going and asks only which of two instruments will do better. You still carry risk, because the relationship between the two legs can move against you.
Go deeper in Harmonic Academy. The community has the weekly briefs, and the core curriculum, the lessons and the live lesson tools are there too.
Join Harmonic AcademyRelated guides
- Crypto Options Trading
- Perpetual Futures & Funding Rates
- Margin, Liquidation & Risk Management
- Hedging
Education only. Not financial advice. Trading derivatives carries a high risk of loss. The figures on this page are illustrative and are not a prediction or a promise of any result.