Home / Learn / Real World Asset (RWA) Perpetuals
RWA Perpetual Futures: How to Trade Gold, Oil and Stocks on a Crypto Exchange
Education only. Not financial advice. Trading derivatives carries a high risk of loss.
Short answer
A real world asset perpetual is a perpetual futures contract based on an index for something from the traditional economy, such as gold, oil or a stock, that trades on a crypto exchange. It has no expiry, uses margin and leverage, and pays or charges funding, just like a Bitcoin perpetual.
What are RWA perpetuals, and how do I trade them? You trade them the way you trade any perpetual. You open an account on an exchange that lists the contract, post margin, choose long or short, and manage your leverage and funding. The differences are in how the price is sourced, when the underlying market is open, and how much the contract trades. This guide covers RWA derivatives for retail traders, and what to watch.
- What are RWA derivatives?
- How RWA perpetuals work
- Gold perpetual futures
- Oil perpetual futures
- Stock perpetual futures
- How to trade an RWA perpetual
- Risks specific to RWA perps
- FAQ
What are RWA derivatives?
A real world asset, or RWA, is something from outside crypto: gold, oil, a stock market index or a company’s shares. An RWA derivative is a derivative based on an index that is defined for that asset. You do not hold the asset. You hold a contract whose value follows the index. An RWA perpetual is that kind of contract with no expiry.
RWA derivatives are not the same as tokenized assets, which are real world assets traded as tokens. This guide covers RWA derivatives, and that is what Harmonic teaches.
In Harmonic’s curriculum, a derivative is a contract whose value is derived from an underlying asset. That now includes gold, oil, equity indices and other real world assets, which trade as perpetual futures on major crypto exchanges. The same mechanics apply across all of them: margin, leverage, funding and liquidation. If those terms are new, start with our guide to perpetual futures and funding rates.
How RWA perpetuals work
- Price source. Each perpetual is based on an index, and the exchange decides what that index is. The index is built from the price of the underlying asset, and the details vary by exchange and contract. For example, one exchange can quote the share price of the QQQ fund, while another quotes the Nasdaq-100 index level itself. Those numbers are not comparable, so read the contract details to see which index the contract follows.
- Funding. It works as it does on any perpetual. A positive rate means longs pay shorts, and a negative rate means shorts pay longs. Funding differs by instrument and by exchange, so check it for the contract you are trading.
- Trading hours. The perpetual trades 24 hours a day, every day. The underlying market does not. It closes for a period during the night, and the hours vary by asset. ETFs and futures tied to the asset trade after hours during the week, but they are mostly closed on weekends. This is the main difference from a Bitcoin perpetual, and it is a source of price gaps.
- Margin and settlement. Many are USDT-margined perpetuals, so your margin and profit and loss are in dollars. Margin rules and maximum leverage differ by contract.
Gold perpetual futures
Gold perpetual futures track the price of gold and let you go long or short with leverage. Gold pays no income, so rising interest rates compete with it, which is the same reason they compete with Bitcoin.
Example from Harmonic’s June 27 Closer
In the week Bitcoin broke below $60,000, gold held above $4,000 for most of the week and traded around $4,039 on Thursday. It was down roughly 20% from its January record high, but it had not broken down the way crypto had. The same dollar and interest rate forces applied to both, and gold was more resilient.
Leverage works as it does on any perpetual. At 3x, a move of about 33% against you reaches liquidation, and at 10x it is about 10%.
Where to read the funding. Check the exchange’s contract page for the current rate and its settlement interval. Harmonic’s Weekly Brief carries a gold line on its funding board each week. The Lesson 7 dashboard in Harmonic Academy shows current funding and the 1, 7, 14 and 30 day annualized averages for gold, so you can see whether the cost of holding is stable or moving.
Oil perpetual futures
Oil perpetual futures track crude oil, such as WTI. Oil reacts quickly to geopolitics, and it feeds into inflation, which makes it a useful reference for macro traders.
Example from Harmonic’s Lesson 4 and June 27 Closer
WTI was near $72 when the conflict between the US and Iran started. After the Strait of Hormuz closed, it spiked to a $113 close on April 7, a rise of about 57%. That fed into inflation, and May CPI came in at 4.2% annual. By late June, with the peace deal in place, WTI had fallen below $70, almost wiping out the gains from the conflict.
The macro link. Oil sits at the start of a chain. In Harmonic’s Lesson 4, a shipping lane closing pushes oil up, higher oil pushes inflation up, and higher inflation changes the data central banks read. That moves rates, and rates move Bitcoin, gold and equities. The Strait of Hormuz carries about 20% of the world’s oil. Our guide to how macro affects crypto walks through the chain.
Stock perpetual futures
Stock perpetual futures track a single company’s shares or an index, and trade as perpetual contracts on a crypto exchange. Two examples from Harmonic Academy show how they are used.
- An index perpetual. In the Capstone, a trader sells the QQQ perpetual outright as one leg of a trade built on money rotating out of AI-tech and into Bitcoin. A stop placed above the market, and a target below it, are set before entry, so the loss is capped if the thesis is wrong.
- A pairs trade. In Lesson 7, the trade is short Tesla and long Intel, using perpetuals on OKX. The ratio between them moved roughly 23% in two days. Our guide to trading strategies explains spread trading.
The Lesson 7 dashboard tracks gold, silver, WTI crude oil, natural gas, QQQ, SPY and ten single stocks alongside Bitcoin and Ether. It shows price and funding, a live correlation matrix and a volume check that flags thin contracts. The lessons, the live lesson tools and the core curriculum are part of Harmonic Academy, along with the weekly briefs.
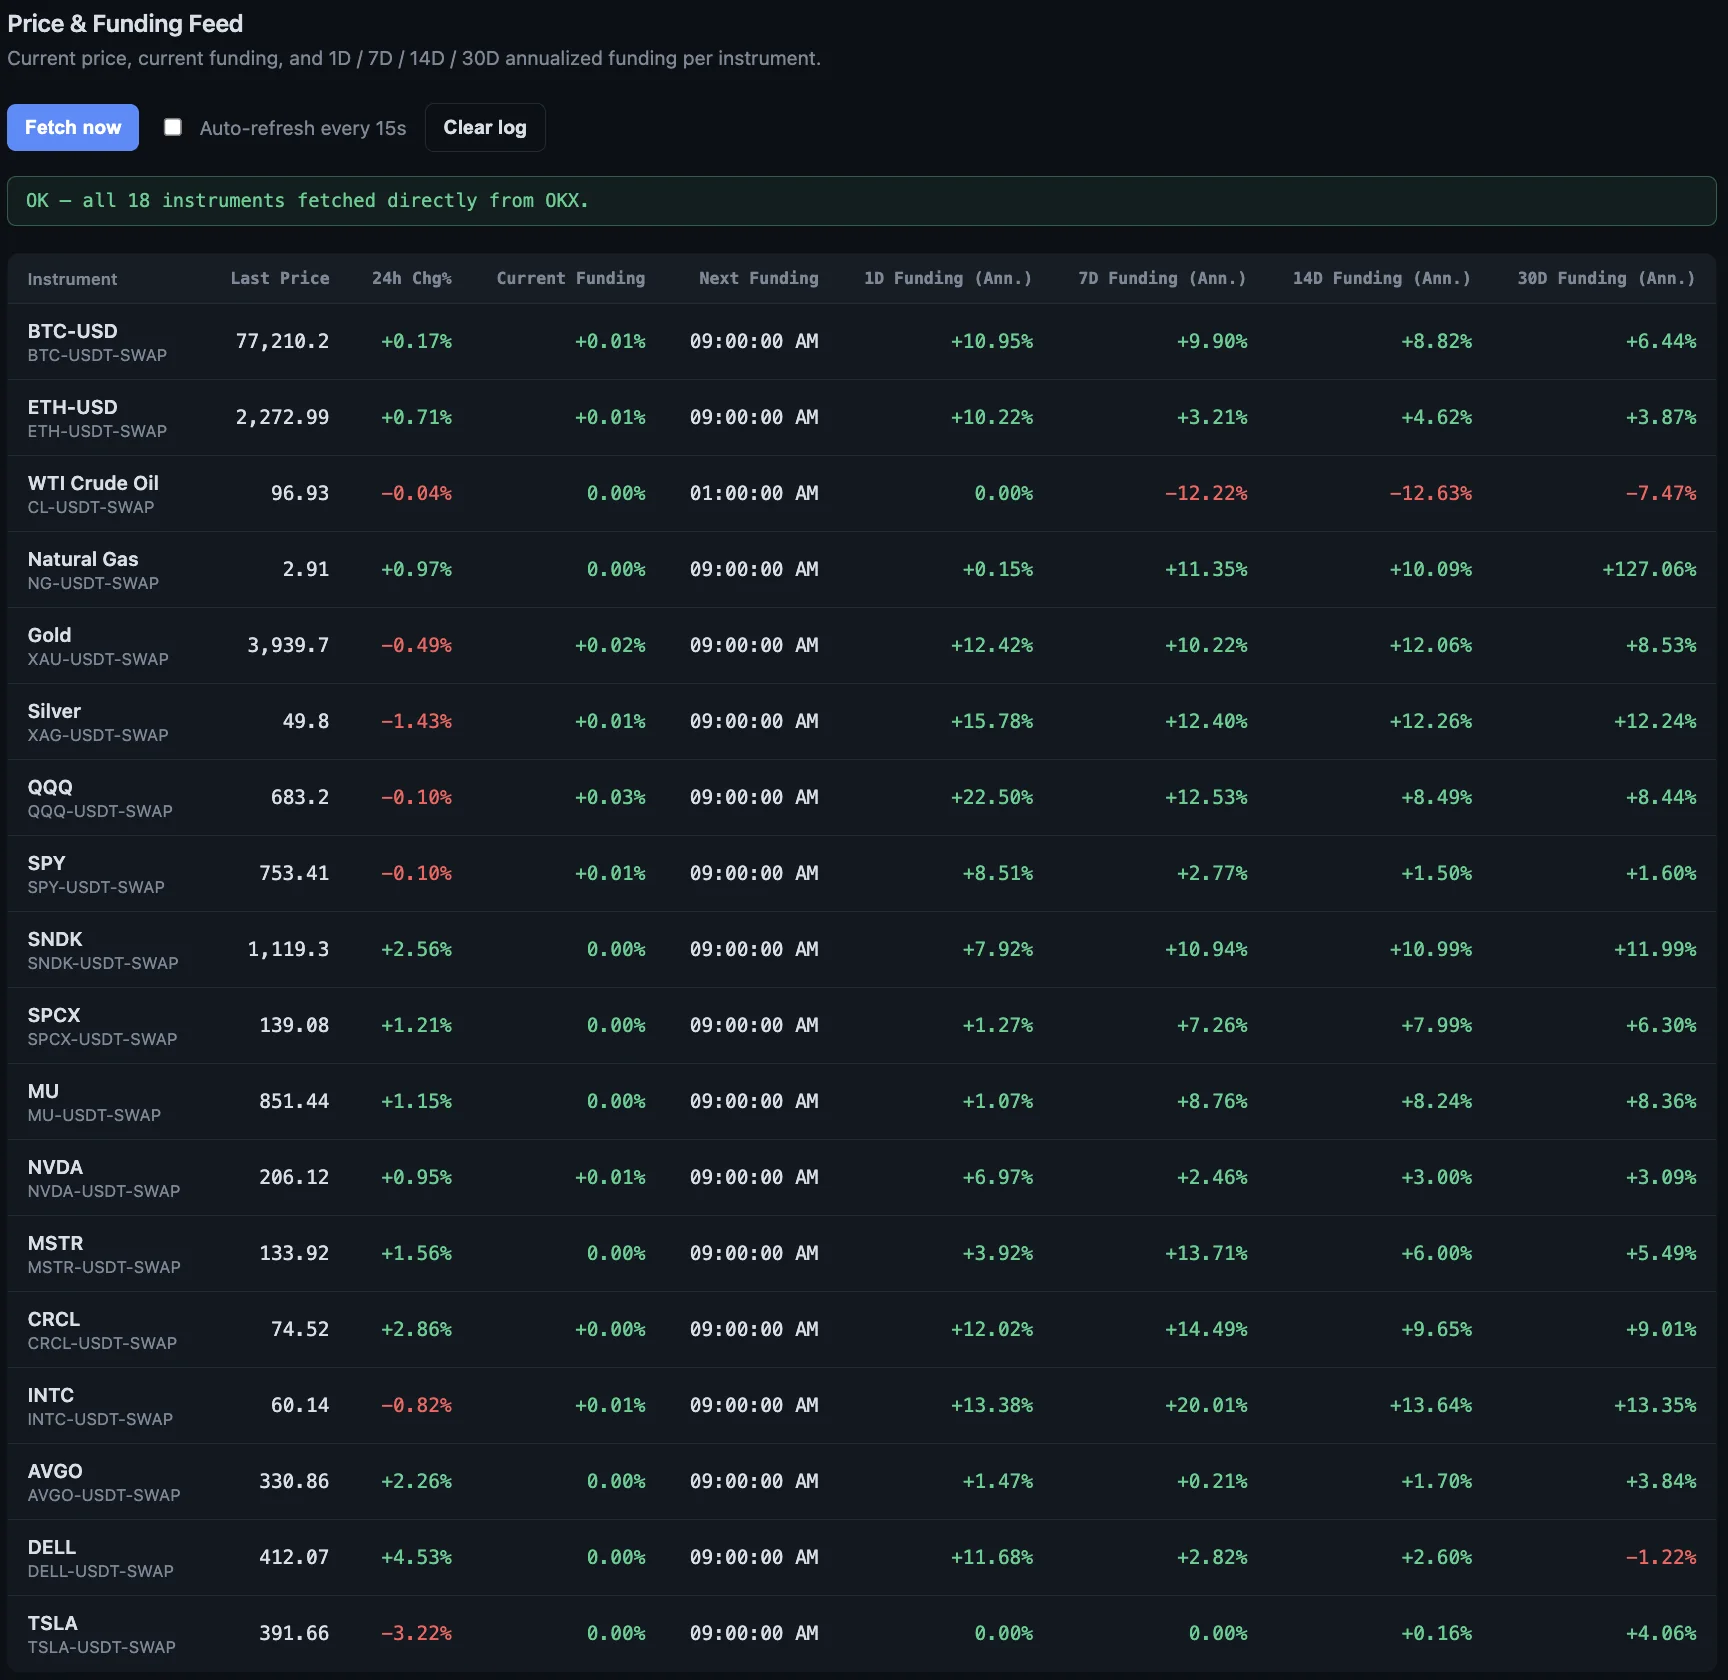
In this capture, gold shows +12.42% annualized funding over one day, WTI crude oil shows 0.00% over one day but −12.22% over seven days, and QQQ shows +22.50% over one day.
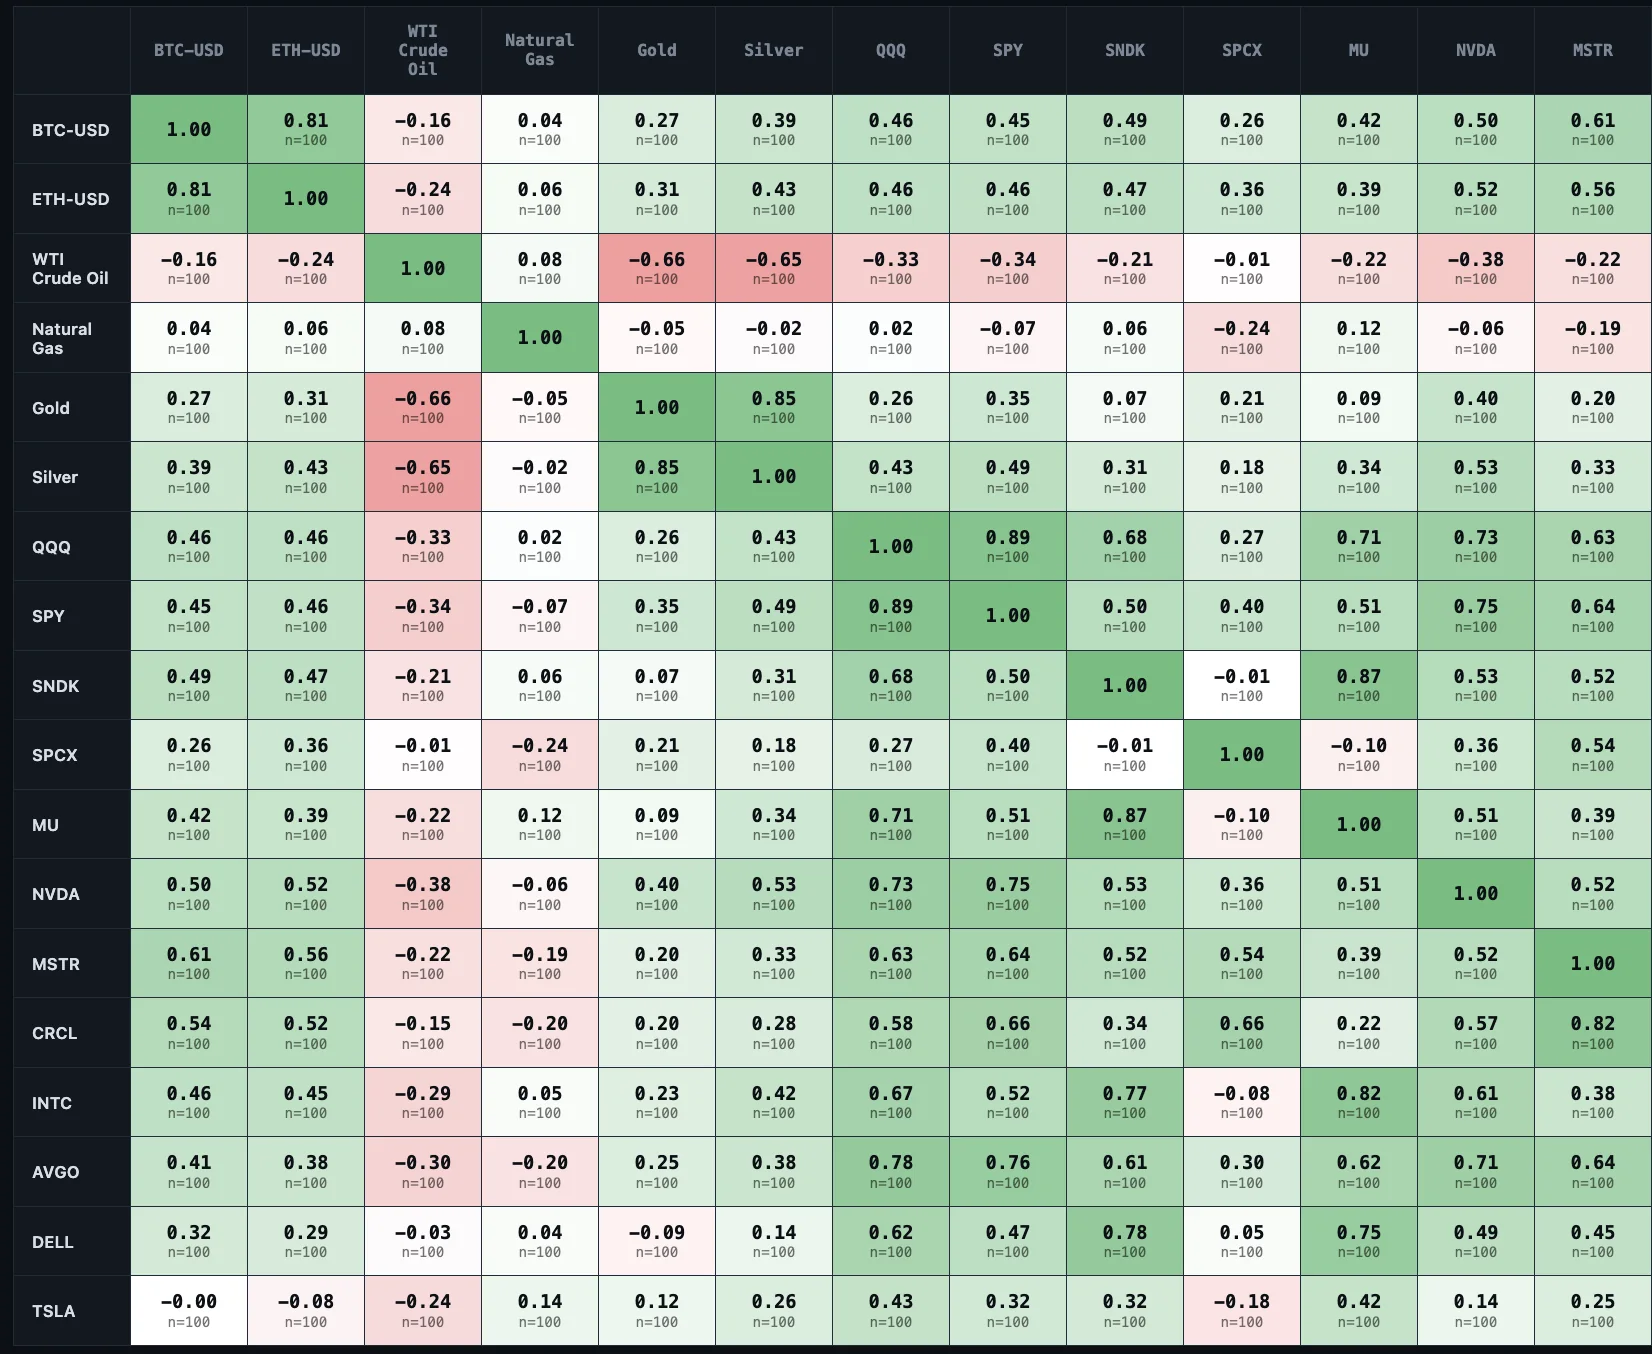
In this capture, gold and silver moved together closely, with a correlation of 0.85, and QQQ and SPY were at 0.89. WTI crude oil moved against gold at −0.66, and Bitcoin’s correlation with QQQ was 0.46. The dashboard also runs a volume check, and it flagged seven instruments as thin, because a thin contract can show a plausible-looking correlation.
How to trade an RWA perpetual, step by step
The question most people ask is how do I trade RWA perpetuals on a crypto exchange. These steps are the short version:
- Pick the asset and read the contract details: the index it tracks, margin rules, funding interval, minimum size and the trading hours of the underlying market.
- Decide your direction, long or short, and write down why. Decide your exit before you enter.
- Select isolated margin, start with leverage of 3x or lower, and calculate your liquidation price before you confirm.
- Check the funding rate, and work out what it costs you to hold the position for the time you plan to hold it.
- Check how much the contract trades. A thin market can show a price that is hard to trade at.
- Set your stop at a technical level, well before your liquidation price, and size the position from that stop.
- Know the schedule of the underlying market, including its closing hours and any scheduled events, before you hold through them.
Our margin, liquidation and risk management guide shows how to calculate a liquidation price and size a position.
Risks specific to RWA perps
- Market closures. The perpetual trades around the clock, but the underlying market closes for a period overnight and is mostly closed on weekends. After-hours trading in related ETFs and futures during the week gives some price discovery, but it varies by asset. Your position can move, and your stop can trigger, while the main market is closed or thin.
- Price gaps. When the underlying market reopens, the price can jump to a new level after news that arrived while it was shut. A stop does not promise an exit at your chosen price, and in a gap the fill can be far from it.
- Thin liquidity. Some of these contracts trade far less than Bitcoin. In a thin market, a price can look plausible but be hard to trade at. Harmonic’s Lesson 7 dashboard flags thin contracts for this reason.
- Weekend risk. In Harmonic’s Lesson 1 case study, a tariff announcement landed on a weekend when liquidity was thin, and $19.3 billion in positions was liquidated in 24 hours. Thin weekend markets are a risk for any perpetual, and a closed underlying market adds to it.
- Contract differences. Price sources, funding rules and margin rules vary by exchange and by contract. Do not assume two contracts on the same asset behave the same way.
- Leverage and liquidation. The usual risks of any leveraged perpetual apply in full.
Frequently asked questions
What is an RWA perpetual?
An RWA perpetual is a perpetual futures contract based on an index defined for a real world asset, such as gold, oil, a stock or a stock index. It trades on a crypto exchange, has no expiry, and uses margin, leverage and funding like any other perpetual. You do not own the asset or a token of it. You hold a contract that follows the index.
How do I trade RWA perpetuals on a crypto exchange?
Open an account on an exchange that lists the contract, post margin, and choose long or short. Select isolated margin, start with low leverage, and know your liquidation price and the funding rate before you enter. Read the contract details first, because the index it tracks and the trading hours differ by contract.
What are gold perpetual futures?
Gold perpetual futures are perpetual contracts that track the price of gold and trade around the clock on a crypto exchange. You can go long or short with leverage, and you pay or receive funding while you hold the position. The contract follows gold’s price without you holding physical gold.
What are oil perpetual futures?
Oil perpetual futures track the price of crude oil, such as WTI, as a perpetual contract on a crypto exchange. Oil reacts quickly to geopolitical news and feeds into inflation, which makes it a useful reference for macro-driven traders. The same margin, leverage and funding rules apply as on other perpetuals.
What are stock perpetual futures?
Stock perpetual futures track the price of a single stock or an index such as the Nasdaq-100 and trade as perpetual contracts on a crypto exchange. They let you go long or short with leverage, and they carry funding like other perpetuals. The underlying stock market has set hours, while the perpetual trades around the clock.
Are RWA derivatives suitable for retail traders?
They carry the same high risk as other leveraged derivatives, plus extra risks such as market closures, price gaps and thin trading. A retail trader should understand margin, liquidation and funding before using them, and should start with low leverage. This is education, not a recommendation.
Go deeper in Harmonic Academy. The community has the weekly briefs, and the core curriculum, the lessons and the live lesson tools are there too.
Join Harmonic AcademyRelated guides
- Perpetual Futures & Funding Rates
- Margin, Liquidation & Risk Management
- Macro and the Fed
- Weekly Market Brief
Education only. Not financial advice. Trading derivatives carries a high risk of loss. The figures on this page are illustrative and are not a prediction or a promise of any result.